1
2
3
4
5
6
7
8
9
10
11
12
13
14
15
16
17
18
19
20
21
22
23
24
25
26
27
28
29
30
31
32
33
34
35
36
37
38
39
40
41
42
43
44
45
46
47
48
49
50
51
52
53
54
55
56
57
| <!DOCTYPE html>
<html>
<head>
<title>绘制基本图形(线)</title>
<meta charset="UTF-8">
<link rel="stylesheet" href="/examples/script/codemirror/codemirror.css">
<script src="/examples/script/lib/jquery-1.11.2.min.js"></script>
<script type="text/javascript" src="/examples/script/codemirror/codemirror.js"></script>
<script type="text/javascript" src="/examples/script/codemirror/searchcursor.js"></script>
<script type="text/javascript" src="/examples/script/codemirror/mode/javascript.js"></script>
<script type="text/javascript" src="/examples/script/codemirror/mode/css.js"></script>
<script type="text/javascript" src="/examples/script/codemirror/mode/htmlmixed.js"></script>
<script type="text/javascript" src="/examples/debug/js/data_box.js"></script>
<script src="./js/helper.js"></script>
</head>
<body style="overflow: hidden; margin:10px;">
<div id="graphWrapper" style="width:800px; height:320px; border:solid 1px #CCC;"></div>
<div id="divData" style="position: absolute; top:340px; bottom:10px; left:10px; right: 10px;"></div>
</body>
<script>
let graph;
</script>
<script type="module">
import { Graph, Polyline, debug } from "/examples/src/index.js";
graph = new Graph({
"target": "graphWrapper",
"enabledGeomEvent": true
});
debug.generateGrid(Object.assign({ "interval": 10, "graph":graph }, graph.getSize()));
let layer = graph.addLayer();
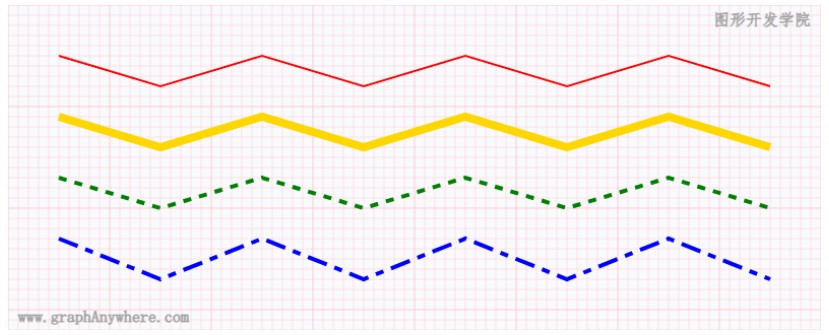
layer.getSource().add(new Polyline({ "coords" : [[50, 50], [150, 80], [250, 50], [350, 80], [450, 50], [550, 80], [650, 50], [750, 80]], "style":{"lineWidth": 2, "color":"red"}}));
layer.getSource().add(new Polyline({ "coords" : [[50, 110], [150, 140], [250, 110], [350, 140], [450, 110], [550, 140], [650, 110], [750, 140]], "style":{"lineWidth": 8, "color":"gold"}}));
layer.getSource().add(new Polyline({ "coords" : [[50, 170], [150, 200], [250, 170], [350, 200], [450, 170], [550, 200], [650, 170], [750, 200]], "style":{"lineWidth": 4, "color":"green", "dash": [8, 8, 8, 8] }}));
layer.getSource().add(new Polyline({ "coords" : [[50, 230], [150, 270], [250, 230], [350, 270], [450, 230], [550, 270], [650, 230], [750, 270]], "style":{"lineWidth": 4, "color": "blue", "dash": [20, 8, 8, 8]}}));
let geoms = layer.getSource().getData();
geoms.forEach( geom => {
geom.on("click", activeShape);
})
graph.render();
</script>
</html>
|