1
2
3
4
5
6
7
8
9
10
11
12
13
14
15
16
17
18
19
20
21
22
23
24
25
26
27
28
29
30
31
32
33
34
35
36
37
38
39
40
41
42
43
44
45
46
47
48
49
50
51
| <!DOCTYPE html>
<html>
<head>
<title>旋转</title>
<meta charset="UTF-8">
</head>
<body style="overflow: hidden; margin:10px;">
<div id="graphWrapper" style="width:600px; height:400px; border:solid 1px #CCC;"></div>
<input type="range" id="slideBar" min="0" max="90" style="margin-top:20px; width:600px" value="30" />
</body>
<script type="module">
import { Graph, Image, Circle, Polyline, Polygon, Text, debug, MathUtil } from "/examples/src/index.js";
let graph = new Graph({
"target": "graphWrapper"
});
debug.generateGrid(Object.assign({ "interval": 10, "graph":graph }, graph.getSize()));
let fontStyle = { "textBaseline": "bottom", "fillColor": "black", "fontSize": 24, "fontName": "sans-serif" };
let layer = graph.addLayer();
layer.getSource().add(new Polyline({"coords":[[550,300],[50,300]], "style":{"lineWidth":2, "color":"#000000"}, "endArrowType":1}));
layer.getSource().add(new Polyline({"coords":[[200,50],[200,550]], "style":{"lineWidth":2, "color":"#000000"}, "endArrowType":1}));
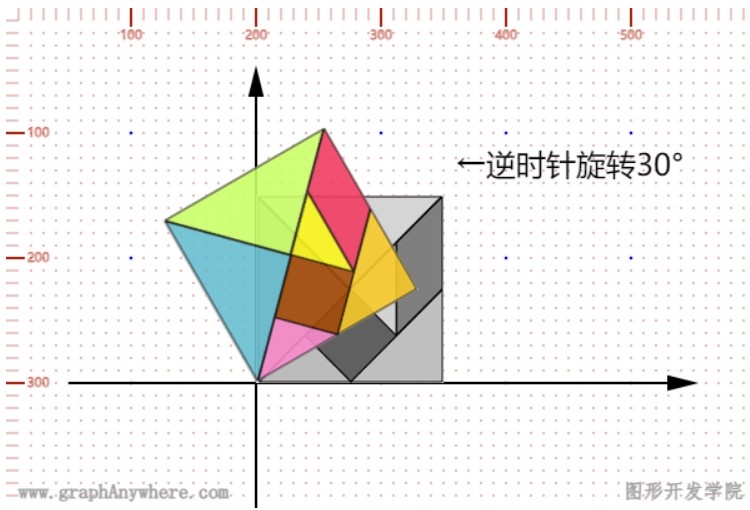
layer.getSource().add(new Image({ "x": 200, "y": 150, "src": "/examples/graph/images/square_150_bg.png" }));
let text = new Text({ "x": 360, "y": 140, "text": "←逆时针旋转30°", "style":fontStyle });
layer.getSource().add(text);
let layer2 = graph.addLayer({"opacity":0.9});
let image = new Image({ "x": 200, "y": 150, "rotation":-30, "origin":[200, 300], "src": "/examples/graph/images/square_150.png" });
layer2.getSource().add(image);
graph.render();
let slideBar = document.getElementById("slideBar");
slideBar.addEventListener("change", function(e){
graph.prop(image, "rotation", - this.value);
graph.prop(text, "text", "←逆时针旋转" + Math.round(parseInt(this.value)) + "°");
})
</script>
</html>
|