Canvas画布操作如何实现图形平移?

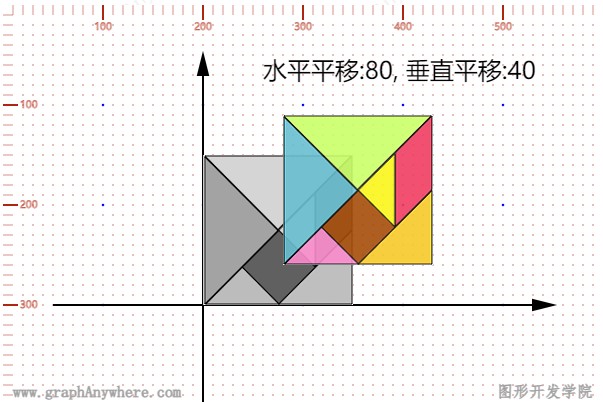
平移就是将一个向量或者点在x和y方向各自移动一段距离。比如,我们有一个矩形,如果我们将它水平移动50个单位,再垂直移动30个单位,就会得到一个新的位置。这个过程就叫做平移。

平移后,原来的坐标(x,y)会变成新的坐标(x’, y’)。这个变化可以用以下的数学公式来表示:

x’ = x + dx
y’ = y + dy

在这里,dx表示横向移动的距离,dy表示纵向移动的距离。所以,我们只需要把原来的x和y坐标分别加上dx和dy,就可以得到新的坐标了。

如果我们用一个矩形来表示这个过程,那么可以写成这样:

[x’ y’] = [a b c d] [x y] + [dx dy]

这里,[a b c d]是一个2x2的矩阵,代表线性变换。但是,平移并不是线性变换,因为它加上了另一个向量[dx dy]。所以,如果我们想用一个矩阵来表示平移,就需要把它变成一个3x3的矩阵,并且加上一个额外的维度(dx, dy, 1)来表示二维平面上的向量。

这种把n维扩展到n+1维的方法叫做齐次坐标表示法。对于平移,我们可以这样表示:

[1 0 dx 0 1 dy 0 0 1]

同时,输入向量也需要升阶,变成这样:

[x y 1]

然后,我们就可以用矩阵乘法来表示平移过程了:

[x’ y’ w’] = [1 0 dx 0 1 dy 0 0 1] [x y 1]

这样,我们就得到了新的坐标(x’, y’)。

除了平移,还有其他的仿射变换,比如缩放和旋转。缩放可以用一个3x3的矩阵来表示,而旋转也是如此。这些变换都可以合并在一起,形成一个更复杂的仿射变换。

另外,还有一种叫做镜像的变换,也叫做对称变换或反射变换。它是关于x轴、y轴、原点或者某条直线的对称变换。比如,如果我们想对一个图形进行x轴镜像变换,就可以用一个特殊的矩阵来实现。

以上就是关于平移和其他仿射变换的一些基础知识。希望对你有所帮助!

示例效果与源代码:

运行效果

1
2
3
4
5
6
7
8
9
10
11
12
13
14
15
16
17
18
19
20
21
22
23
24
25
26
27
28
29
30
31
32
33
34
35
36
37
38
39
40
41
42
43
44
<!DOCTYPE html>
<html>

<head>
<title>平移</title>
<meta charset="UTF-8">
</head>

<body style="overflow: hidden; margin:10px;">
<div id="graphWrapper" style="width:600px; height:400px; border:solid 1px #CCC;"></div>
</body>

<script type="module">
import { Graph, Image, Circle, Polyline, Polygon, Text, debug } from "/examples/src/index.js";

// graph对象
let graph = new Graph({
"target": "graphWrapper"
});

// 网格水印层
debug.generateGrid(Object.assign({ "interval": 10, "graph":graph }, graph.getSize()));
let fontStyle = { "textBaseline": "bottom", "fillColor": "black", "fontSize": 24, "fontName": "sans-serif" };

// 变形之前的数据层
let layer = graph.addLayer();
layer.getSource().add(new Polyline({"coords":[[550,300],[50,300]], "style":{"lineWidth":2, "color":"#000000"}, "endArrowType":1}));
layer.getSource().add(new Polyline({"coords":[[200,50],[200,550]], "style":{"lineWidth":2, "color":"#000000"}, "endArrowType":1}));
layer.getSource().add(new Image({ "x": 200, "y": 150, "src": "/examples/graph/images/square_150_bg.png" }));

let text = new Text({ "x": 260, "y": 80, "text": "水平平移:80, 垂直平移:40", "style":fontStyle });
layer.getSource().add(text);

// 变形之后的数据层
let layer2 = graph.addLayer({"opacity":0.9});
let image = new Image({ "x": 280, "y": 110, "src": "/examples/graph/images/square_150.png" });
layer2.getSource().add(image);

// render
graph.render();
</script>

</html>

尝试一下 »